What ice cores from Law Dome can tell us about past and current climates
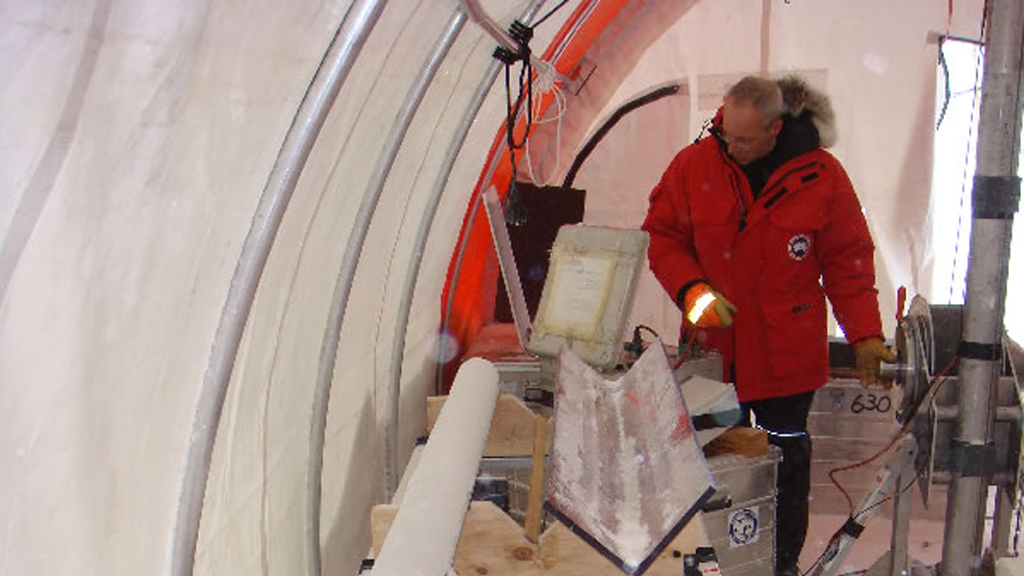
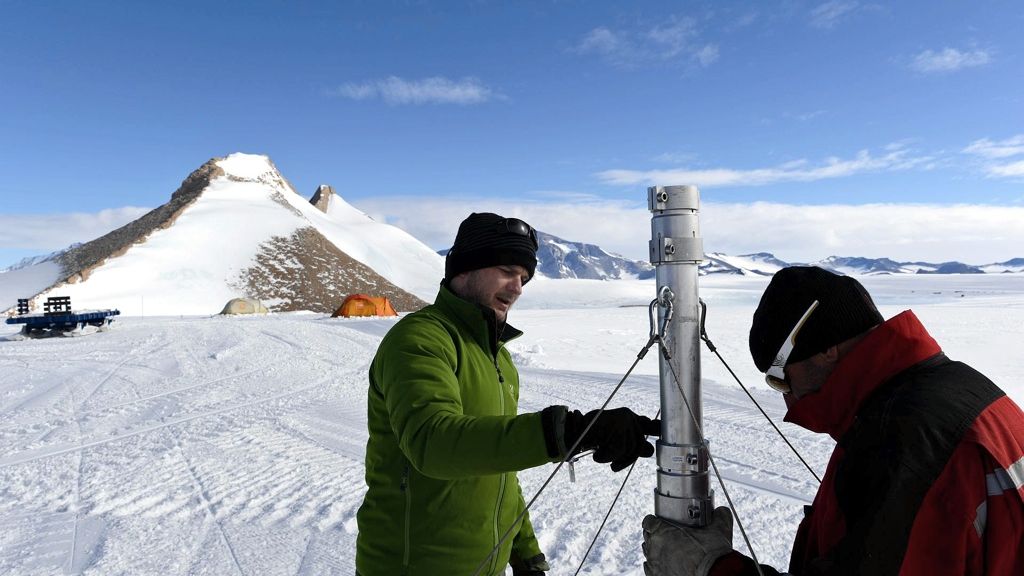
Tas van Ommen working with a section of an ice core at Law Dome in Antarctica
© JOEL PEDRO
As a paleoclimatologist from the Australian Antarctic Division, Dr. Tas van Ommen spends his time studying ice cores extracted from the Antarctic Ice Sheet in an effort to have ever clearer reconstructions of past climates as well as calibrate ice core data against modern meteorological data.
Dr. van Ommen and his colleagues have been extracting ice cores from Law Dome region in East Antarctica for a number of years. In this interview, he discusses ice core dynamics, why Law Dome is an important location to extract ice cores, and what kind of information these ice cores has been able to give about climate phenomenon elsewhere on the planet.
Can you tell us about the ice cores you’re taking at Law Dome and what kind of information you’ve been able to get form them?
Law Dome is the principal place where we’ve done most of our work, within the framework of international collaborations. Our focus has been on getting ice cores that are highly resolved – meaning we can see what has been happening on a year to year basis. Being a coastal location, the rate of snowfall is much higher than in the deep interior of Antarctica. The high rate of snowfall gives you the ability to resolve annual layers in the ice core very well, which allows you to date each layer in the core very well.
The Law Dome core goes down almost to the bedrock. It’s 1,200 metres long and goes back about 90,000 years. But because of the way glaciers thin due to the flow of the ice, as you go down deeper, the bulk of the core covers the last 4,000 – 10,000 years, and then the earliest 70,000 years is compressed in the bottom few tens of metres.
Can the manner in which the ice flows make it more difficult to identify the correct chronology of the layers in an ice core?
Yes it can, in the sense that you have to understand the flow and have a way of eventually identifying dating markers. You can only resolve the upper layers of the ice core on an annual basis by taking samples that are finely enough spaced to detect annual changes. Deeper down, as the layers become thinned by flow it eventually becomes impractical to get fine enough sample spacing to detect the
individual layers. So, in fact, at Law Dome at the moment we have a published layer-counted record that goes back 750 years. We’re working on data now that will take us back 2,000 years being able to actually count individual layers.
So in any parameter we measure we can clearly see seasonal cycles. For example, the ratio of isotopes in water molecules, either oxygen-18 (18O) or deuterium (2H), show clear seasonal cycles; you can see highs in summer and lows in winter, and count them back quite readily. There are also similar cycles in sea salts. We find that wintertime is marked by much higher salt loadings in the snow. This is understood to be predominantly from greater storminess and higher wind speeds over the ocean, which leads to a greater transport of sea salts into the atmosphere.
So you can detect these very clear seasonal cycles and count back. You can look at the thickness of each layer and, aside from the regular thinning, which is something you can calibrate for from the glaciological flow, you can see how the year-to-year snowfall has changed over time. At the moment we’ve been able to do that over a 750-year period. So it’s a very powerful way of looking at environmental changes that have taken place over time at the site.
What makes Law Dome an ideal area to extract ice cores?
Law Dome is marked by a very strong gradient in snowfall. It’s got very high snowfall on the eastern side where the Polar Easterly winds hit the flank of Law Dome. You have orographic uplift (when rising terrain forces a moving air mass from a low elevation to a higher elevation) of the moisture and high snowfall grading off quite steeply as you go over the summit of the dome and down the western side to areas where net snow accumulation is almost zero. This makes the region a wonderful laboratory for understanding how change in snowfall affects the signals in the ice.
What other ice cores being taken in that part of East Antarctica?
As far back as the 1980s, there have been traverses in Wilkes Land, which is the part of Antarctica in the immediate vicinity of Law Dome. We’ve got some cores going down over 100 metres in the Porpoise Bay region in East Wilkes Land, which we’re still working on. And we’ve also taken a core recently from Mill Island, which we’ve only just begun to analyze, and it’s looking like it’s going to be a very interesting site.
All of these sites have been near coastal sites, at less than 2,000 metres elevation, which have similar very high snowfall to Law Dome, and this allows us to get well-resolved climate records.
Has examining the data from these ices cores helped you make any prominent discoveries related to climate?
The biggest result we’ve had recently, and one which received quite a bit of attention, was that we found a link between snowfall at Law Dome and drought in Southwestern Australia. This was quite a surprise to us. We did know from the snowfall record that we got out of Law Dome that the last 30 years or so has been marked by a significant rise in the amount of snowfall. Levels are above the long-term average.
When we started looking at what the atmospheric circulation was doing, which was bringing in this extra snowfall, we found a very large-scale atmospheric pattern, which, while it was bringing warm, moist air southwards onto the coast of East Antarctica, it was part of a big gyre which was taking colder, dry air northwards towards Australia.
In fact, in the southwest part of Western Australia, the cold, dry air has been associated with what has been a 30 to 40-year significant drought in winter rainfall. It’s been quite a concern; it’s affecting a highly productive agricultural region where a lot of wheat is produced. Since about 1970, they’ve seen a drop of about 15 to 20% in winter rainfall. There have been lots of reasons proposed and investigated, but we now believe that at least one contributing factor has been an intensification of this atmospheric gyre.
On the basis of this connection we were able to take about 750 years of snowfall record at Law Dome and see how unusual the recent period is – whether it’s something we see cyclically or it’s something unusual. What we found is that the last 30 to 40 years stands out as a complete outlier. It’s not something that’s within the band of natural variability at all over that 750-year period.
Is this enough evidence to link these anomalous conditions to climate change?
We’ve got the smoking gun that shows this recent period is outside the range of natural variability. But there is another clue that is quite tantalizing. There’s been climate modeling done looking at the impacts of ozone depletion over Antarctica and what that’s done to atmospheric circulation over Antarctica in particular. Some of the model runs that look at the changes in atmospheric circulation during the late 20th century show the same intensification of this gyre we’ve identified that’s associated with the snowfall, and ozone forcing seems to be responsible. More modelling is required; however it’s quite suggestive that the ozone depletion has spun up this gyre of circulation.
There’s a meteorological name for this gyre. It’s part of what’s called the Zonal Wave 3 Circulation around Antarctica. It turns out that because of the three southern continental landmasses of South America, Africa and Australia, and the three ocean basins between them, you get this pattern of circulation which tends to have stronger meridional (north-south) flow in alternating regions as you go around Antarctica. So it’s Wave 3 Circulation pattern south of Australia that’s transporting the cold, dry air northwards and the moist air southwards.
It’s a very interesting result that’s going to help get a handle on causes of the drought. In the association we see between the snowfall and the drought, we can account for about a quarter of the decadal variability at the decadal scale is associated with the drought. While it might not be the only factor, it’s certainly important.
There have been a few studies over the past few years that predict that as the hole in the ozone layer repairs itself, this could lead to greater warming.
Yes. That’s possible because another thing the hole in the ozone layer over Antarctica has caused has been an intensification of the Westerly winds around Antarctica. A feature of the circulation is that there’s an atmospheric pattern a little bit like the Zonal Wave 3’s.
There’s another one called the Southern Annular Mode. If you think of a doughnut with a hole in the middle, the donut itself is the band of high winds around Antarctica. What happens is that there’s a ridge of high pressure in the hid-latitudes in the Southern Hemisphere that extends over Australia, South America and Africa, and that ring of high pressure has been forced southwards somewhat and it’s tightened the pressure gradient between the mid-latitudes and the Antarctic coast. This tighter gradient of pressure leads to an intensification of the Westerly Winds, which means a strengthening of the Southern Annular Mode. And again, ozone forcing seems to be very likely implicated as a factor.
That intensification to a certain degree has shielded Antarctica from the warming at lower latitudes. There’s a suggestion that as the ozone hole repairs itself, we may see a reversion of this Southern Annular Mode to a more normal state, meaning the Westerly Winds would slacken, there would be more transport of heat to Antarctica and it would to an extent start to catch up on the warming seen elsewhere.
In my opinion that’s a little speculative. Yet there certainly seems to be some fairly strong evidence that so far this tightening of the pressure gradient – the intensification of the Southern Annular Mode – has shielded Antarctica from some of the warming.
But wouldn’t the thermal inertia of the Antarctic Ice Sheet not lead to any radical melting of the ice any time soon in most parts of Antarctica (excluding the Antarctic Peninsula)?
As you go inland in Antarctica, you’re talking about regions in the interior with temperatures of -30°C, -40°C, and even -50°C annual average. Even with a little bit of warming, it’s not going to drastically affect the ice sheet in the interior regions of the continent. The greater concern is what happens where the ice sheet comes in contact with the ocean.
For instance, in West Antarctica in the regions of the Pine Island and Thwaites Glaciers, you’re seeing the greatest change is mass because you’ve got (strongly implicated again) ocean circulation bringing warmer water onto the continental shelf and into contact with ice and that’s where the action is – where the ocean meets the ice in a warming world. That’s where the concern lies.

Tas van Ommen
Tas van Ommen is a paleoclimatologist from the Australian Antarctic Division invovled in the international ICECAP project. His resarch interests lie in ice core palaeoclimate studies, with a focus on high resolution palaeoclimate work extending back into the last glacial period. He uses date from ice cores extracted from the Antarctic Ice Sheet to improve reconstructions of past climates and calibrate ice core data against modern meteorological data.
-
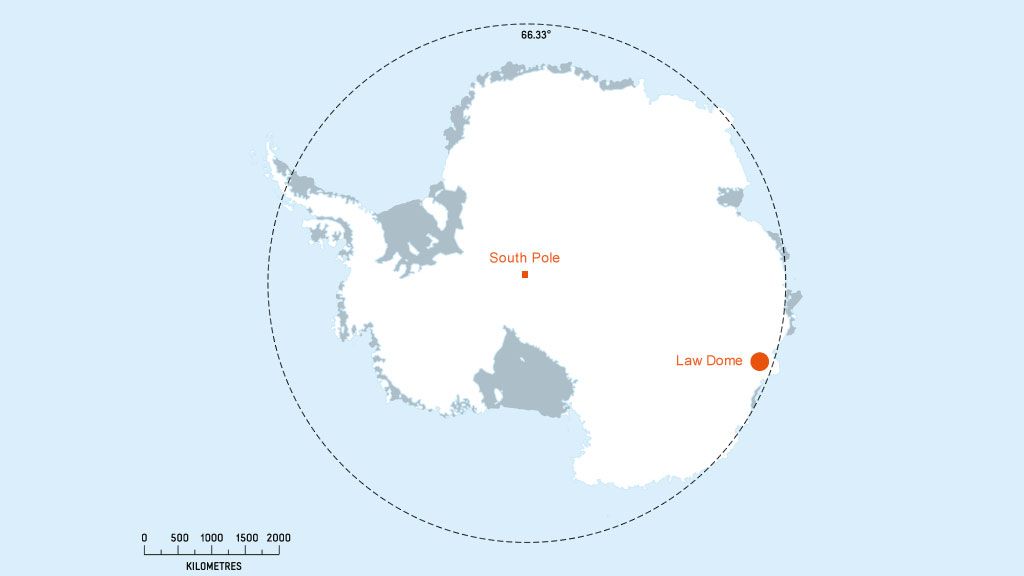
Law Dome is located just south of Cape Pointsett in Wilkes Land
© IPF