Greenland Ice Sheet melt and the complexities of sea level rise

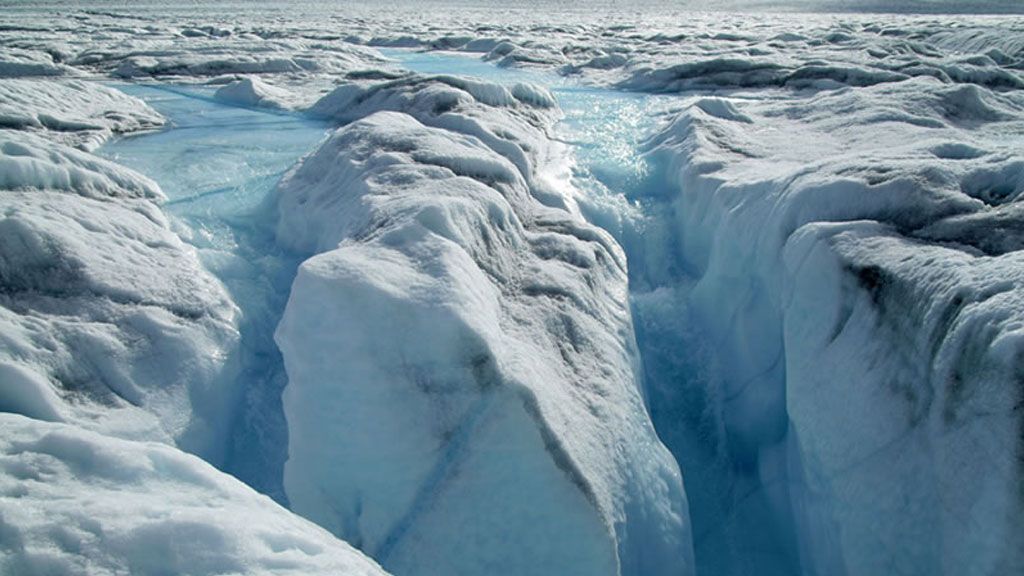
Meltwater flowing into a moulin.
© CIRES
Professor Konrad Steffen, formerly the Director of the Cooperative Institute for Research in Environmental Sciences (CIRES)at the University of Colorado and currently the Director of the the WSL Institute for Forest, Snow and Landscape Research explains how he and his colleagues have been measuring and modelling the response of the Greenland Ice Sheet to climate variations and change, as well as its impact on global sea level rise.
Could you rewind 20 years and tell how Swiss Camp came to be established on the Greenland Ice Sheet?
At the time, I was a member of the faculty at the Swiss Federal Institute of Technology (ETH) in Zürich, Switzerland. We were mostly doing climate and energy flux measurements at high elevations - for the most part in places with ice – when our institute decided to draft a new project to do research in Greenland.
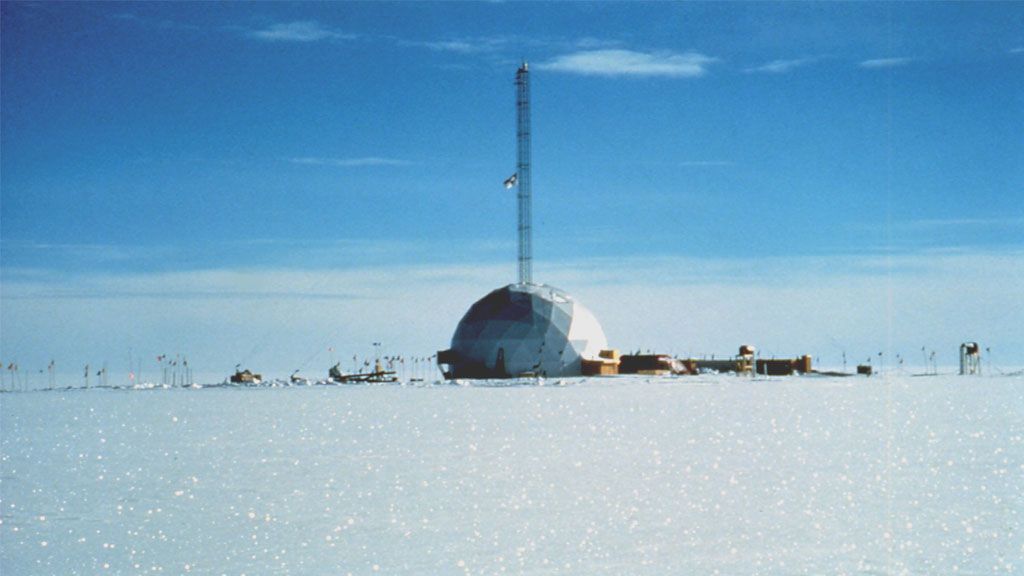
The planning stage took two years, and I was in charge of the first expedition to establish a camp on the Greenland Ice Sheet, at an altitude where any snow precipitation melts throughout the summer. This is called the accumulation equilibrium line. At the time it was located at an altitude of 1,150 metres. At this location, setting up a tent directly on the surface melts the snow underneath, so we had to erect a platform with the assistance of a heavy load helicopter. The platform was wooden and rested on 18 metal pillars drilled into the ice. The camp was completed within a month and included a 30-metre tower for making measurements over a three-year period.
What sort of measurements where you taking?
Mainly climate measurements, including energy fluxes, sensibility and temperature heat flux, and latent heat (heat required to melt the ice) flux. We’d installed parallel instruments on about five different levels on the tower, and had special radiation instruments to measure the incoming solar long wave sky radiation reflected from the surface. We also drilled into the ice and installed sensors 60 metres down below the surface.
We had a very successful measurement campaign over the first two years, with people coming in and out on a regular basis. I personally stayed about one and a half years at the camp overall, usually from May through to October.
What happened next?
In 1991, Mount Pinatubo exploded in the Philippines, and the following year - by which time I had already transferred to the University of Colorado - the entire Arctic had cooled down by an average 1.5˚C. As a result, the snow never melted along the equilibrium line where Swiss Camp was located. This was the year we had planned (and were in theory obliged by the Danish government) to dismantle the camp, but the extra snow prevented us from doing so. At the time, we had a small device to contact the outside world and I sent an email to the program manager at NASA, asking him if he wanted to buy a camp for one dollar. He immediately wrote back “of course”. What I didn’t tell him them is that he would also have to provide me with funding to keep the camp going…
Fortunately, things worked out, and for the next 20 years I got funding in three to four year increments (because NASA does not directly support long-term monitoring). Originally it was just one site, then I started to develop a bigger program called the Program for Arctic Regional Climate Assessment (PARCA). By the end we were about ten different Universities and three national labs carrying out research on the ice sheet. I coordinated it from the University of Colorado, but the money came from NASA. That is how we started to set up a network of monitoring stations across the ice sheet that are still operating today.
Where are these stations located?
They are located right around the ice sheet at an altitude of 2,000 metres, as well as along the spine and summit regions of the ice sheet.
Is Swiss Camp still in existence today?
Yes it is. In fact, last year I went back because Greenland became much warmer and the accumulation line moved higher up. As a result, the camp platform started to become unstable. With the help of my graduate students we secured the platform, so it should hopefully be stable for another ten years.
What measurements are you doing there now?
We now have three towers at Swiss Camp, measuring something like 45 different parametres for climate, radiation, and UV radiation. For the past 12 years, we have also been measuring velocity using a network of GPS units that measure change very accurately.
In addition, we also carry out radar profiles to look through the ice, and study the shafts or fissures, called Moulins, through which melt-water drains from the surface to the base of the ice sheet, causing the ice sheet not only to loose mass, but to flow more rapidly. These measurements show that during the summer time, when the ice melts on the surface, the ice sheet suddenly moves 50% to 100% faster towards the coast. But this only happens over a short time period of a few weeks during the summer when water drains through the moulins and lubricates the base of the ice sheet.
Where does the term ‘moulin’ come from? How are they formed?
‘Moulin’ is the French word for mill. It was first used in this context by a Swiss glaciologist working on the Rhone glacier in the 1820s. He used it to describe how melt water carves out the ice in a clockwise motion like a mill.
Moulins do not usually go straight down to the base of the glacier; they more often go down vertically for say 10 metres, then horizontally for maybe 100 metres, then down again for perhaps 20 metres, and so on in stages until it ultimately reaches the bottom of a glacier or the ice sheet. They usually form where there is a crack or otherwise some kind of softer ice that it progressively carved out.
What happens once the water actually reaches the bottom of the ice sheet?
Unfortunately we haven’t yet been able to look right down to the bottom of the ice sheet. In the past, we threaded down some two kilometres of fiber-optic cable into some moulins, but couldn’t get all the way down because the horizontal pass in the moulin was longer than our cable.
What we think is happening over the few weeks of year when the most water flows down through the ice sheet, is that the sheet actually gets lifted up by the water as it starts to push between the bedrock or the sediments and the ice, reducing friction, acting as a lubricant. This is when we start to see the increase in velocity. It’s cyclical, and it all takes place over a peak in melting that goes on for a very short period of a couple of weeks.
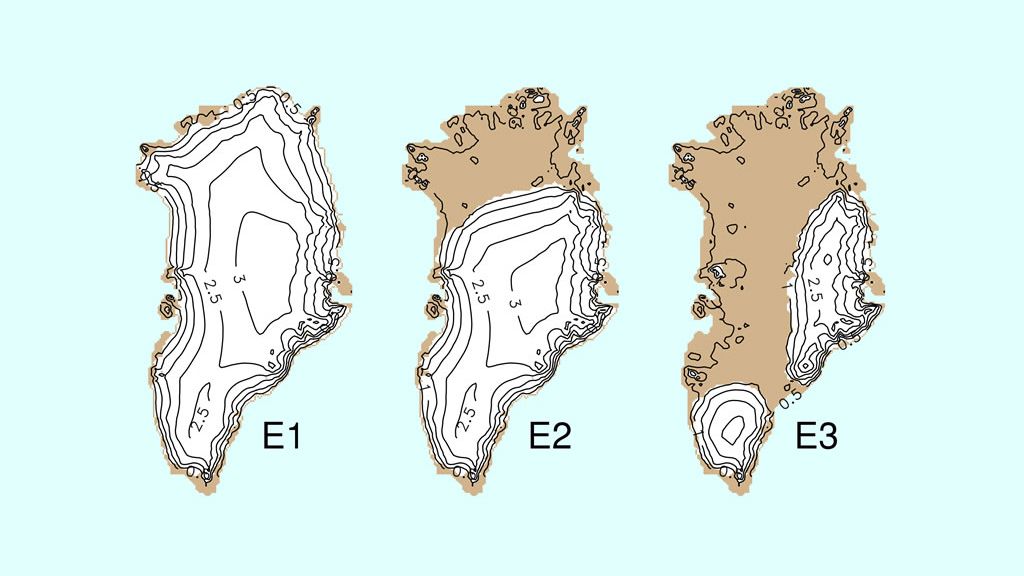
Can you explain why the higher regions of the ice sheet are growing in elevation even as the outer edges of the ice sheet are melting faster?
This is because the higher the air temperature, the more humidity it carries. As these air masses get pushed up over the big ice dome of Greenland, the air then cools down and looses its humidity through precipitation. So in a warmer climate, it is to be expected that we should have more precipitation, and this is clearly visible in the radar altimetre of the satellites operated by my colleagues at NASA.
If you take a long-term record, you can see that the inland regions of the ice sheet is growing by about one and a half centimetres per year. However, at the same time, along the coast, the increasing melt and flow rate and increased lubrication outbalances the increase in mass at the centre. So if you take Greenland as a whole, the extra mass is not enough to compensate for the extra loss via melting and more icebergs being transported into the ocean. The ice mass balance is currently negative.
Where do we stand today in terms of temperature rise for Greenland?
In climatology, you need a record of at least thirty years to look at change, and for Greenland, the longest record we have only goes back twenty years. Nevertheless, looking at yearly mean temperature over the last ten years, we can see an increase of about 2˚C over that period.
The strongest warming has been happening in winter, which is to be expected in a warming climate. But of course the winter is still sufficiently cold to prevent melt during that period. On the other hand, the summer temperature has increased by about 0.7˚C, which is not as much as the winter increase, but nevertheless still significant. And contrary to winter warming, it does increase melt.
What are the consequences of Greenland ice mass loss? And why does sea level varies in different parts of the world?
Today, the annual ice mass loss from Greenland is about the same as the ice mass loss from all other glaciers worldwide, excluding Antarctica. If you add Antarctica to the equation, ice sheets, ice caps and glaciers, contribute about 2 to 2.5mm of global sea level rise annually. However, as your question suggests, the ocean is not rising equally across the globe. There is no such thing as ‘mean’ sea level rise.
For example, if we melt one metre sea level rise equivalent from Greenland and pour it into the ocean, the ocean directly around Greenland will not rise. This is because the Greenland landmass will suddenly have less ice weighing down on it, which means it will rise up from the Earth’s crust, countering the rise in sea level. In addition, as a result of the gravitational pull from the spinning Earth, if you add the equivalent of one metre of sea level rise to the oceans in the Northern Hemisphere, it will translate to about 1.6 metres sea level rise in the Southern Hemisphere, and only about 40 cm in the Northern Hemisphere.
And in reverse, if Antarctica, located in the Southern Hemisphere, contributes one metre to global sea level rise, it will translate into a 1.6 metre sea level rise in the Northern Hemisphere, around the coasts of Europe, Asia, and North America, and 40 cm in the Southern Hemisphere. So the measure of sea level rise actually depends on where the source is, as a result of the gravitational pull of the Earth and redistribution of the water.
However, what I am describing is only a simplified model. The reality is more complicated, because the oceans then redistribute some of that disparity over time. This is still currently under investigation, but we believe it takes decades for water to flush from the Pacific into the Atlantic and circulate globally.
What are some of the consequences of this disparity?
The disparity in the regional footprint of sea level rise also has an affect on the temperature of the oceans, and the topography of the oceans is now being measured very accurately by satellites. We now know that some regions are already above mean sea level rise, whilst others are below, with differences of 10 to 20 cm. But in addition to temperature, you also have other factors, such as changing oceanic circulation, which has a direct impact on the energy content of the oceans and thus increases or decreases its height. And then you have the gravitational affect of the moon that holds or pulls the water during the tides.
Of course, what people in Bangladesh want to have, is predictions for their own regional sea level rise. That’s why my colleagues in California are now putting together a proposal for NASA to study sea level along specific stretches of coastline, and I am organizing a workshop in the spring of next year at the Max Planck Institute in Germany, drawing together the different oceanic models we can use to obtain a high enough resolution to determine sea level rise on the regional level.
Getting a regional resolution is of course much more complex and that is why I usually avoid discussing regional sea level in public, as we do not have good answers yet. There will be regions where sea level is going down even though just a few hundred kilometres away the water will be rising.
Does this imply that ice loss in Greenland could accelerate the melting of the West Antarctic Ice Sheet, given a rising sea level would change the line of buoyancy on its outlet glaciers and ice shelves and increase the rate of ice discharge into the sea?
Yes, if you increase sea level in the Southern Hemisphere you will actually extend the exposure of ice to the ocean through uplift. And since warming ocean temperature is the driving factor in Antarctic ice loss and melt, then the Greenland melt can be seen as an accelerator of melt in Antarctica, which in turn will further raise sea level in the North. It’s a kind of loop feedback effect.
Do we know if Greenland ice mass loss has reached a tipping point, and is this a useful way of looking at the problem?
By definition, a tipping point is a point of no return. I personally try not to use this term because it would mean that we fully understand the system. In the case of Greenland, however, we can say that if we have a scenario where over a period of 100 years, the Earth’s mid-latitudes have registered a 2˚C rise in temperature, then that would equate to a 4˚C rise in the Polar Regions. At that level, no increased precipitation on the interior of the Greenland Ice Sheet could ever compensate ice loss around the edges.
This means that the 2°C warming in mid-latitudes that has been agreed as acceptable by the EU and other governments, is in fact already a dangerous threshold for Greenland, especially as any carbon that is being added to the atmosphere now, will take centuries to dissipate. Of course, the Greenland Ice Sheet will not melt overnight. It will take thousands of years.
People often assume that we can overshoot the target and then in fifty years we can reverse the process when we have developed the technology to make us carbon free. But the carbon will already be in the atmosphere and is not going to disappear rapidly. We will actually be stuck with a 4˚C rise at the Poles for centuries, if not thousands of years. This is a dangerous stiuation, especially when talking about ongoing ice mass loss in ice sheets.
How fast is Greenland losing ice today?
It depends on how you look at it. The discharge, or how much water we actually loose by simply melting, is about 250 gigatons – or about 250 cubic kilometres of water. But to that, you should add 400 gigatons of ice loss through the increasing rate of iceberg calving and discharge.
So if you add and compare these two figures to the 450 gigatons of snow accumulation on the ice sheet, you can see that we have a negative balance of around 200 gigatons.
How do these figures translate into mean annual sea level rise?
320 gigatons of melt corresponds to approximately 1mm of sea level rise. So Greenland alone contributes about 0.6 to 0.7mm sea level rise today, and this figure is increasing rapidly.
Has the contribution of ice melt to mean annual sea level rise overtaken that of oceanic expansion yet?
Yes it has. Until recently, thermal expansion of the ocean accounted for about 50% of sea level rise, but in the last few years, this figure has gone down. Although there is no clear indication as to why, we know that today the contribution of melting land ice is about 60% to 70%, with only 30% to 40% due to the thermal expansion of the ocean.
Finally a paper came out recently, stating that scientists may have overstated the rate of ice loss in Greenland because of the miss-calibration of observation satellites. What is your response to this?
Yes, this was interesting paper, and resulted from a new way of looking at isostatic rebound (how landmasses rise up as mass weighing dowon on them - in this case ice - disappears from them). Whereas the basic data that is used in many other papers is the GRACE gravity data, in this paper, the researchers also used GPS data. Although the approach is very good, the problem at this stage, is that the data set in question is still too short and thus has wide margin of uncertainty to it. In ten years from now, we will have a much better idea. But right now, the ice loss they quote is not in contradiction with other papers; it’s just at the lower end of the range of estimates. This is explained by the fact that other papers have a large margin of error because of the uncertainty linked to isostatic rebound of the Greenland landmass.
So this new paper does not really stand in contradiction to previous papers, but unfortunately the press misinterpreted it as saying that Greenland is not losing mass. That is not what the paper says. The paper proposes a lower magnitude of mass loss, but one that is still significant.

Konrad Steffen
Professor Konrad Steffen is formerly the Director of the Cooperative Institute for Research in Environmental Sciences (CIRES)at the University of Colorado and currently the Director of the the WSL Institute for Forest, Snow and Landscape Research. He has been carrying out field research and monitoring in Greenland for twenty years. He is one of the world’s leading experts in measuring and modelling the response of the Greenland Ice Sheet to climate variations and change, as well as its impact on global sea level rise.