History and dynamics of the Greenland Ice Sheet
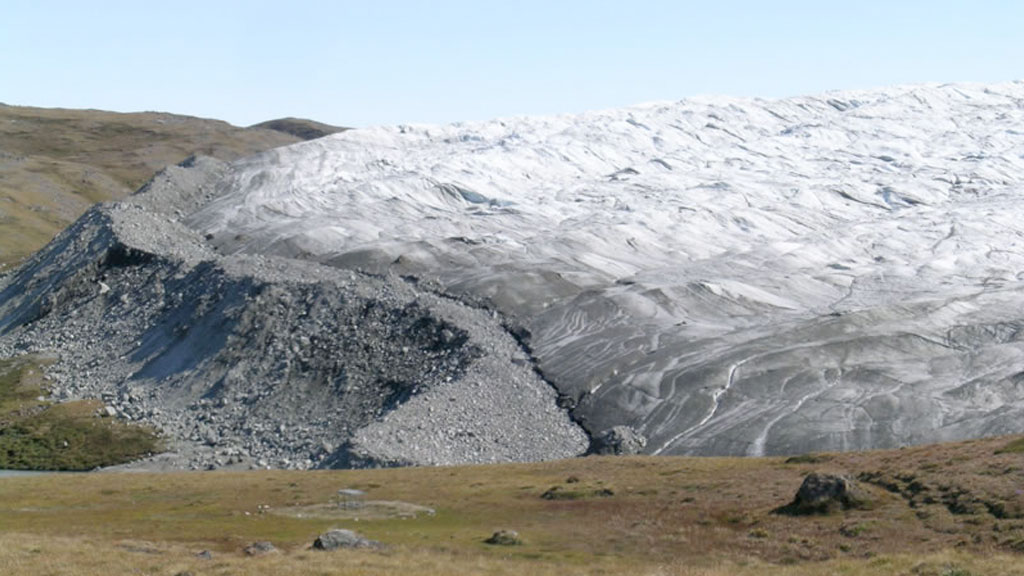
The edge of the ice in Kangerlussuaq
© Beàta Csathó
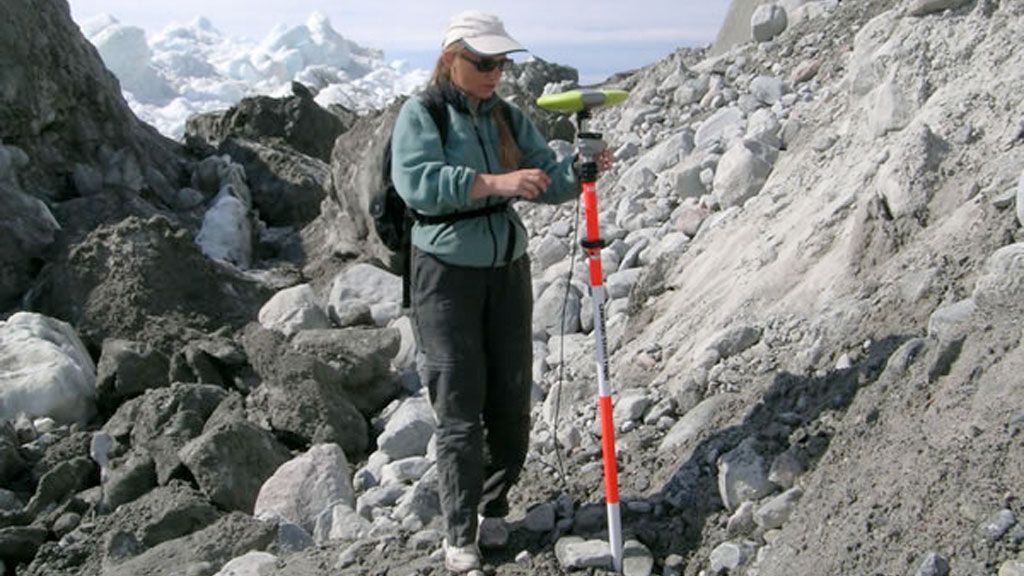
Dr. Beáta Csathó of the State University of New York (SUNY), Buffalo has been studying the Greenland Ice Sheet for a number of years and is currently involved in a number of projects funded by NASA and NSF.
At the moment she's studying the mass balance of the Greenland Ice Sheet using ICESat satellite laser altimetry with Tony Schenk of Ohio State University and the reconstruction of historical outlet glacier changes as part of the project "IPY: POLENET/Greenland: Using Bedrock Geodesy to Constrain Past and Present Day Changes in Greenland's Ice Mass" with Michael Bevis, also of Ohio State University. Along with her colleague at SUNY Buffalo, Jason Briner, Dr. Csathó is also a co-Principal Investigator on a project entitled "The Sensitivity of the Greenland Ice Sheet to Climate Change: Reconstructing the response of the Jakobshavn Isbrae during the Little Ice Age and Holocene Thermal Maximum."
In this interview, Dr. Csathó discusses the history of the Greenland Ice Sheet and how it is currently being observed. She also looks at the ice flow dynamics of certain important Greenlandic glaciers.
What can you tell us about the history of the Greenland Ice Sheet?
It's a very complicated story. One could go back hundreds of thousands of years. But in the Sensitivity of the Greenland Ice Sheet to Climate Change project I'm working on, we're only going as far back as the Last Glacial Maximum 15,000 years ago, so I can tell you about its history since then and how we know what we know.
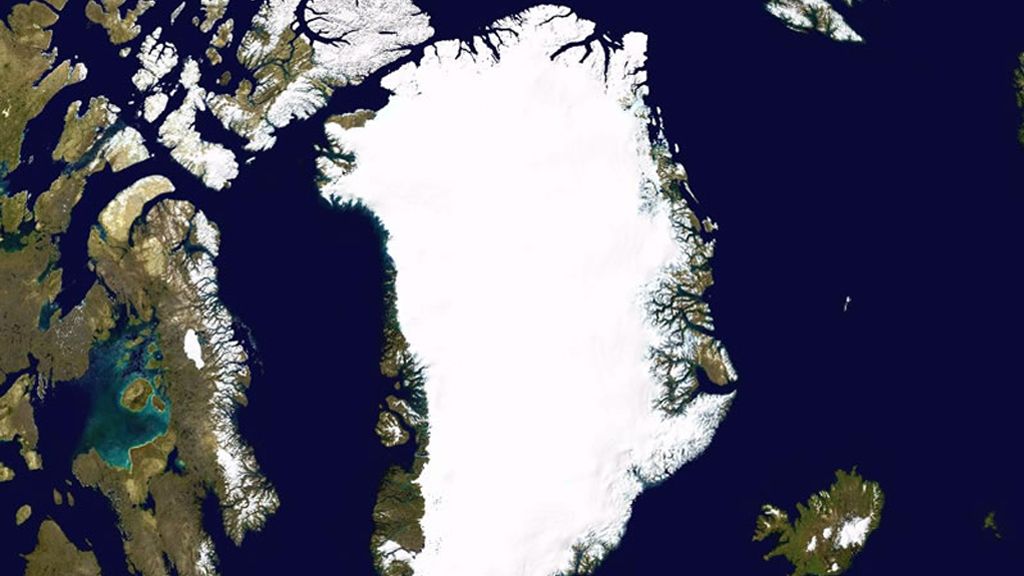
15,000 years ago, the Greenland Ice Sheet was much bigger than it is now. Most of the area that's currently outcrop was covered with ice and the ice sheet extended beyond the present coastline to cover at least the inner continental shelf. Using calibrated carbon-14 dating of basal lake sediments and fossils of bivalves (molluscs with two-part shells) found in raised marine deposits, we know that the broader west Greenland margin was generally deglaciated by 11,000 - 10,000 years ago and that the ice margin retreated out of Disko Bay around 10,000 - 9,000 years ago and onto land 9,700 - 9,600 years ago. We're using cosmogenic exposure dating (using the amounts of certain isotopes of certain elements present in a rock surface to determine the minimum amount of time a rock surface was exposed to the air) to refine the details of this retreat.
And what's happened since then?
Studies done prior to ours suggest that the ice sheet continued to retreat beyond the current ice sheet boundary due to climate warming that took place over a period of time. Then after a point the ice sheet started to re-advance, reaching its most recent peak during the Little Ice Age. Based on historical evidence, it is currently believed that the ice sheet reached a maximum somewhere between 1850 and 1880. We're currently dating sediment cores from ice sheet threshold lakes (lakes that receive glacier sediment when the ice sheet is nearby) to tell when the edge of the ice sheet was close.
As for how much bigger the ice sheet was in volume or mass during the last peak, I don't believe anyone currently has a reliable estimate. However we can map the vegetation trim lines (line marking the most recent highest extent of the glacier), which has allowed us to learn that the extent of the ice used to be several hundred metres above its current level - even as recently as 100 years ago in some places. In our project we're developing an approach that uses 3-D mapping of these trim lines to approximate the volume change that has taken place since the Little Ice Age in the Jakobshavn drainage basin.
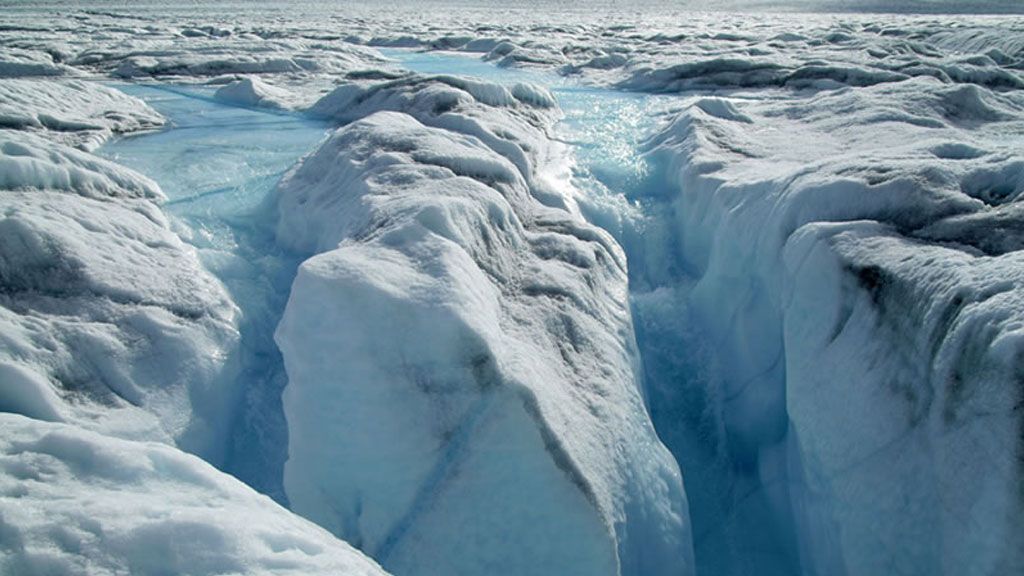
After it reached its peak during the Little Ice Age, the ice sheet began to thin again. In the 1930s and 40s there was a remarkable period of more rapid thinning and retreat, similar to what we're seeing today. After that it became colder again until 1995 or 1997 or so, and during this time the ice sheet remained more or less stable. Since then we've seen rapid melting on the ice sheet, particularly in the southeast. It's becoming clear that the ice sheet is losing mass at an increasing rate, and thinning has been slowly moving north, especially on the west coast, approaching the Peterman and Humboldt Glaciers in the northwest.
How far back does solid data exist for the Greenland Ice Sheet?
Aerial photographs started being taken in the 1930s and 40s, which is the first completely reliable data one can actually use to do comparisons with the present. The US Air Force did flights over Greenland during and immediately after the Second World War collecting tri-trimetrogon photographs with a mapping camera that could look sideways and down, allowing coverage over large areas.
Are you able to compare the current rapid melting to the rapid melting that took place in the 1930s and 40s?
We don't have data for the whole ice sheet, but we have enough from certain glaciers, and comparisons between the rapid melting that took place back then and today will be done soon. Along with a few groups in the USA, the UK and Denmark we're currently working on using these old data to provide estimates of mass loss between the 40s and 80s. We've compared the aerial photos from the 40s and declassified satellite images from the Cold War era with more recent aerial photographs (1980s) and satellite images (1990s-2000s), and noticed a lot of thinning and retreat took place in several different places in Greenland. Then we had a look at the temperature record and more detailed studies carried out at the Jakobshavn Glacier in the 40s, and we noticed that there was a correlation between thinning and temperature changes, although with a bit of a delay. What's unusual about the current melting that's been going on since the 1990s is that melting started almost simultaneously with an increase in temperature.
The Greenland Ice Sheet has been monitored quite closely since the early 90s. What kinds of methods are being used?
The first good data set was collected by aircraft. NASA has a P-3 aircraft equipped with an Airborne Topographic Mapper (ATM), a laser altimeter that measures the surface of the ice sheet very precisely. The P-3 is a fast aircraft. It can fly quite high, and it's designed to cover a big area. Since 1992 NASA has been taking profiles of different parts of Greenland at different times, re-taking the same profiles periodically, making it possible to have an updated composite map of the whole ice sheet every so often.
NASA and ESA also started using satellites in the 1990s. We use satellites to:
- Estimate the mass balance of the ice sheet by measuring the volume of ice loss directly by mapping surface elevation changes.
- Measure ice velocity. In this case snow accumulation over the ice sheet (incoming flux) is compared with ice flux moving out from the ice sheet.
- Measure changes in gravity fields. If the ice sheet is losing ice, the mass loss allows the crust to rise, changing the gravity field around it. NASA has a satellite called GRACE, which measures gravity fields nearly everywhere on Earth, and it's been used to estimate mass changes of the Greenland Ice Sheet.
We also measure how much the crust is rising from continuously operating GPS stations placed all over Greenland, which provides additional data that helps us improve our ice sheet mass balance estimates.
During the summers of 2007 and 2008, there was a marked increase in the rate of snowmelt on the ice sheet, especially in the north. What does this portend for the upcoming melting season?
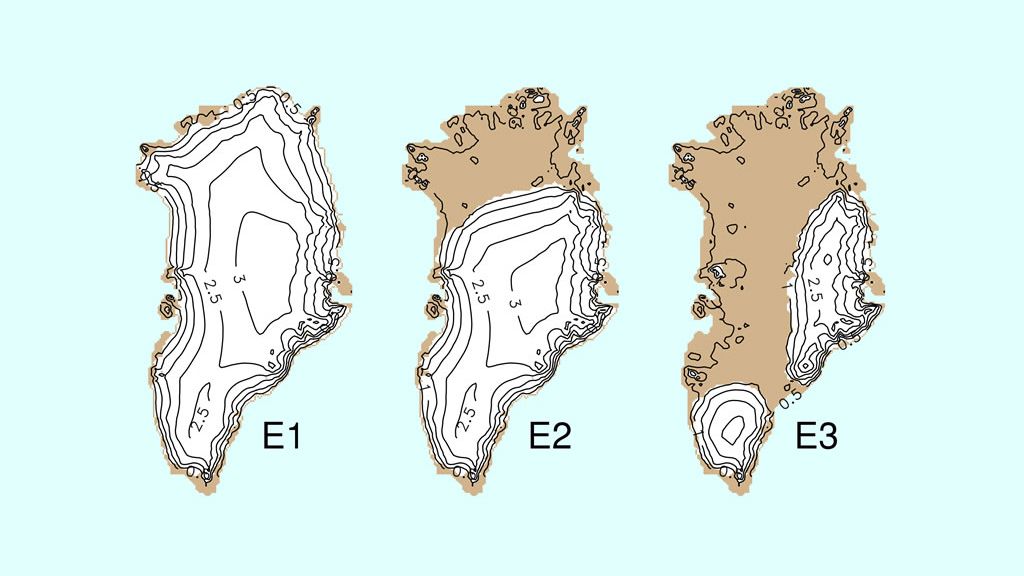
Dr. M.R. van den Broeke of Utrecht University gave a presentation on this topic at the 2009 EGU General Assembly in Vienna. He and his research colleagues combined the results from mass balance studies and actual measurements of surface melt and concluded that the Greenland Ice Sheet will change quite a lot and that there's a chance that the whole southern part of the ice sheet might become an ablation zone (an area where overall loss exceeds overall gain).
Greenland has several sensitive regions, which includes not only the south, but also the northeast, where the ice sheet is lower and thus more sensitive to an increase in mass loss. However in the northwest, the margin of the ice is quite steep,and it's one of the driest and coldest parts of the ice sheet. But you can find surface lakes created by melting there, and I wouldn't be surprised if melting has increased there, although it would likely only occur within a thin band around the edge of the ice sheet.
Does this mean the northwestern part of the ice sheet is the most stable part of the ice sheet?
Not necessarily. Both NASA and Jason Box from Ohio State University compared satelltie images from 2000 and 2008, which showed that a huge piece of ice about 20 km x 20 km broke off of the northern edge of the Humboldt Glacier sometime between the tiem the two photos were taken. It was a major calving event.
The Humboldt is a funny glacier. It's very wide, but the northern andsouthern parts are very different from one another. The northern part,which is where the calving event took place, acts more like an outletglacier, and the southern part is much lower and grounded. It lookslike there's a channel on the northern part of the glacier, which iswhy mass loss is happening much faster there and why this part of theglacier is more sensitive. We're planning to do more research on thenorthern part of the glacier soon.
There's also evidence from drilling and geophysical research that in northwestern Greenland the bedrock is warmer than one would expect. According to our interpretation of gravity data, the Earth's crust is thinner in the area, which means the mantle is closer to the ice in this part of Greenland and is heating up the ice a bit more. This could have a major effect on its dynamics.
Our project recently presented some findings that indicate some very complicated ice dynamics on the Humboldt. You see increased thinning towards the edge near the ocean, which means either oceanic or atmospheric warming is causing it. But as you go upstream on the glacier, the ice is thickening.
What is this thickening due to?
Usually if you have thinning at the edge of a glacier, as you go upstream it thins less and less. But patterns of thickening and thinning are very complicated. If you take the Jakobshavn, which is one of the most interesting and dynamic glaciers in Greenland, there's a lot of thinning at the coast, which reaches tens of meters near the calving front. But as you go upstream, thinning decreases gradually, and once you reach 2,000 metres in elevation in the accumulation zone of the ice sheet, thinning is more or less zero and is even a bit positive in places. In fact the middle of the ice sheet as a whole is still in balance, and may even still be thickening slightly.
The Humboldt is a much more complex case. You have thinning at the edges, but when you go a little further upstream you have an area where you have thickening. This usually indicates that the speed of the glacier has changed relatively recently, which could be related to changes in bottom conditions such as subglacial lubrication for example. There are some glaciers, like Ice Stream C (Kamb Ice Stream) in West Antarctica, which turn on and off (It was flowing rapidly 100 years ago but stopped suddenly and began thickening upstream). Also glaciers often "steal" ice from each other, so it could be that ice that was previously flowing to the Peterman Glacier and got diverted to the Humboldt Glacier. In this case, more ice flows upstream, but the ice velocity downstream remains unchanged, so you get a thickening upstream.
So I'd say the thinning on the edges of the Humboldt is most likely a climate signal, while the thickening upstream is likely due to ice dynamics related to recent changes in flow dynamics in that area.

Beata Csatho
An Associate Professor at the State University of New York (SUNY) at Buffalo, Beáta Csathó's research interests lie in monitoring ice sheet mass balance and ice dynamics in order to understand ongoing rapid changes in the cryosphere. Her research combines geophysical, remote sensing, climate and glaciological observations to understand the linkages between subglacial geology and ice sheet dynamics. She also reconstructs cryospheric changes from historical observations and develops new methods for change detection, data fusion and visualization to support Earth science applications.