CryoSat-2 and its mission
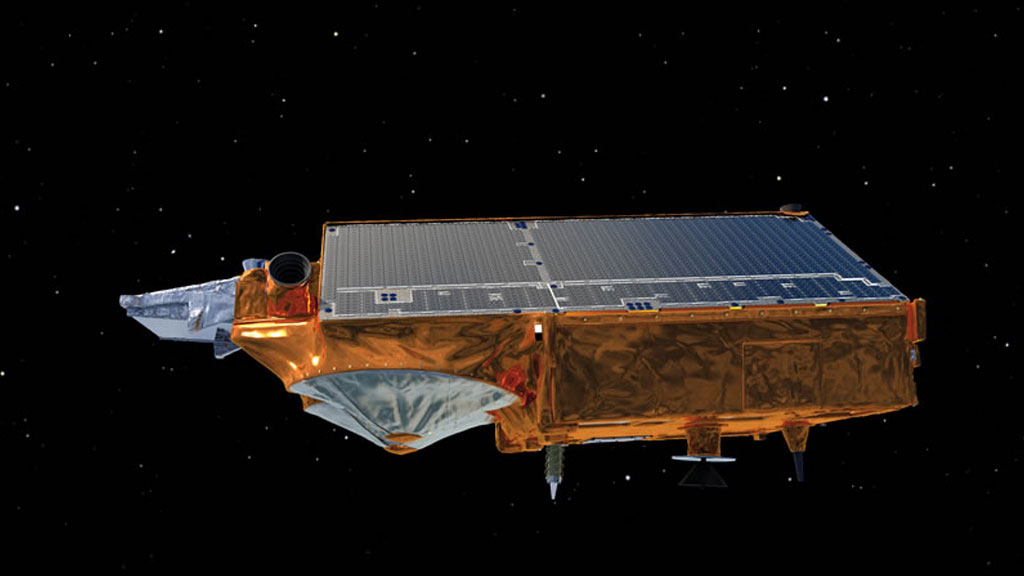
Side view of CryoSat-2
© ESA - AOES MEDIALAB
With the successful launch of CryoSat-2 on 8th April 2010, the European Space Agency (ESA) has put a powerful new tool for observing the cryosphere into orbit. The new satellite’s primary mission will be to measure changes in the thickness of both sea ice and land ice.
How long have you been working on the CryoSat programme?
I’ve been the mission scientist for CryoSat since arriving at ESA in 2000. I’ve followed the CryoSat mission since it was first proposed to ESA, including the development of the first CryoSat (which was unfortunately lost) and the second one, which we’ve recently successfully placed into orbit.
Since becoming the Division Head in 2007, I’m now in charge of a lot more activities than just the scientific preparations for CryoSat. I’m responsible also for calibration and validation campaigns for all current satellite missions, of which there are three new Explorers including CryoSat in orbit. In total we’re been helping prepare for about 20 different Earth observation missions covering a broad span of different activities in different scientific areas.
How does the CryoSat mission fit into the grand scheme of the Earth observation missions at ESA?
CryoSat-2 is the third satellite launched in a series of six complementary Earth Explorer missions, each of which is making its own contribution to Earth systems science, how climate varies and the natural and anthropogenic influences on climate. In the last year, we’ve launched two other satellites aimed at addressing very specific scientific objectives. The two missions are called the GOCE (Gravity field and steady-state Ocean Circulation Explorer) mission, which is ESA’s gravity mission launched in March 2009, and the SMOS (Soil Moisture and Ocean Salinity) mission, which was launched in November 2009 and is currently going through its commissioning phase before it will start to deliver data to the scientific community.
GOCE is a metrological mission, which gives us a basis for making high-precision measurements with CryoSat. The Earth’s gravity field determines how the orbit of CryoSat-2 varies. Further, the new gravity gradient measurements from GOCE give us what we call a geoid – a high resolution model of the Earth’s equipotential field – and this gives us an accurate height reference for making measurements with CryoSat-2. GOCE is thus very complementary to CryoSat because it provides base information the instruments on CryoSat-2 can use to make more accurate measurements of ice thickness and variation.
SMOS measures ocean salinity variation. This complements the CryoSat mission because melting ice sheets, which CryoSat-2 is keeping an eye on, affect ocean salinity as they dump freshwater into the salty ocean. These two complementary missions will help us understand how salinity drives ocean circulation and how freshwater input into the ocean is influencing this circulation.
CryoSat-2’s mission is to measure the rate of change in the thickness of both land and sea ice. How will it do this?
CryoSat-2 uses a number of instruments. Its primary instrument is an all-weather radar altimeter called SAR Interferometric Radar Altimeter (SIRAL), which is a new generation of altimeter when compared to its predecessors (ERS-1 altimeter, ERS-2 altimeter and the radar altimeter currently used on Envisat). We employ what we call mode switching onboard the satellite. It’s driven autonomously onboard the satellite by a geographic map called a mask. This is essentially a map containing coastlines and ice features, including sea ice extent and how it varies from season to season. This is used to tell the satellite where around its orbit to switch between three different measurement modes (low resolution mode, SAR mode and SAR-interferometric mode) depending on what kind of ice surface it’s over.
Over level surfaces (for example over the interior of an ice sheet or over the open ocean), the satellite switches into a default low-resolution mode (LRM), which uses more conventional altimetry. We know from the performance of previous satellite altimeters this method is best in these situations. When CryoSat-2 operates over sea ice, it switches to high-resolution SAR (synthetic aperture radar) mode. Sea ice is relatively level, so using SAR to measure sea ice works well. The heights of ridges on the sea ice usually vary by only a few metres.
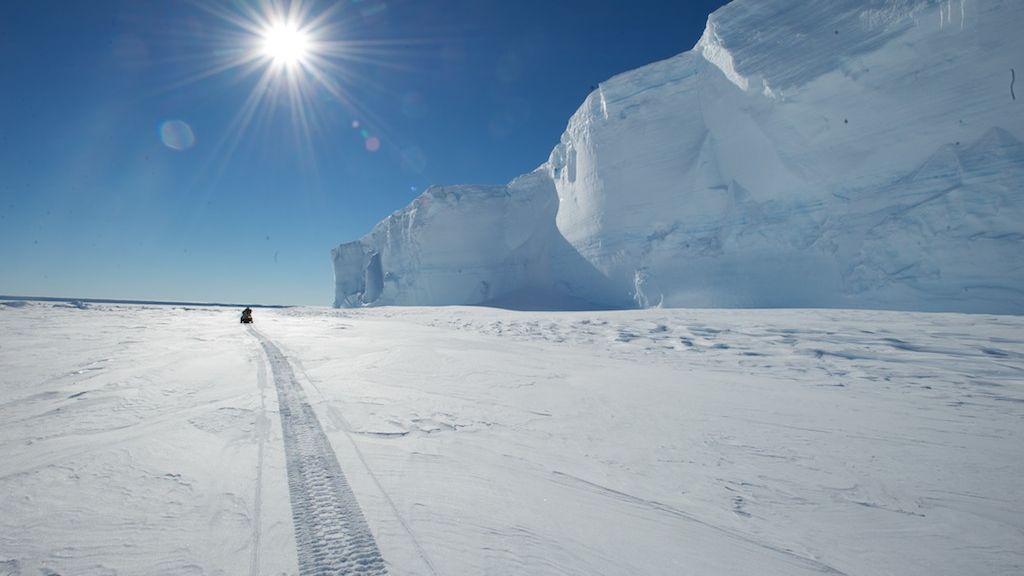
However, ice sheets are far more rugged, so for taking measurements over ice sheets, CryoSat-2 switches its SIRAL instrument to SAR interferometric (SAR-In) mode. This means the satellite uses its twin antennas to measure the height of rapidly varying topographic features on the land ice. This sets it aside from other satellites. The satellite sends a radar pulse from one antenna (approximately 720 km down to the surface of the ice sheet) and then both this and a second antenna receive an echo back from the surface. There’s a small phase shift in the echo between the two receiving antennas which allows us to pinpoint the echo source on the surface. This new feature allows us to measure very accurately the height variations around the edges of the ice sheet at an along-track resolution of less than 300 metres - a major improvement over previous radar altimeters. The SIRAL instrument’s interferometric capability also allows us to be far more agile in tracking the rather complicated terrain around the edges of the ice sheets and gives us continuous tracking around the edges of the Greenland and Antarctic Ice Sheets, where we’ve had problems getting comprehensive data with previous satellites.
What else makes Cryosat-2 different from previous satellites?
If we want to understand the net volume change of the pack ice in the Arctic, we need to fly as close to the North Pole as possible. CryoSat-2 flies closer to the poles than any other satellite with an orbit inclined at 92° N, which means there’s only a 2° “hole” without data near the North Pole. This is closer to the pole than ICESat (NASA’s laser altimeter satellite that was taking data from 2003-09) flew. This helps us close the budget in terms of volume changes in sea ice in the Arctic; in other words, the amount of fresh water locked up as ice floating around the ocean. It will give us a more complete picture of how the sea ice extent changes we’ve seen in passive microwave time series data over the last 20 years are related to net ice volume change. This is something we won’t know until we do this more comprehensive mapping over the course of the CryoSat mission.
Since when have ice thickness measurements at the edges of ice sheets been going on, and what kind of data have researchers been able to gather about them?
ICESat was the first satellite to accurately measure ice thickness around the ice sheet margins using a laser altimeter. It was able to give us a new pair of eyes because its laser altimeter was able and agile enough to map these kinds of areas. The only limitation of ICESat data is that measurements could be affected by optically thick cloud cover and weather patterns in these regions. ICESat also had some technical difficulties which only allowed its operation over periodic intervals. So while the quality of the data ICESat collected is excellent, we were only able to get a patchy time series with which to investigate the details of changes over time.
What we’ve also found out is that previous radar altimeters were unable to accurately track areas where the topography is too rugged. With CryoSat-2, we’ll be able to fill in the geographic gaps in the time series acquired by previous radar altimeter satellites. This will enable us to provide more robust time series that reflects the changes we are witnessing around the edge of the ice sheets.
So is CryoSat-2 currently the best satellite in orbit for measuring ice?
I’m not saying the other ones weren’t good. What I’m saying is that we’ve progressively been making technological advances, to the point that we now have the technology to address past shortcomings of data acquired by previous instrumentation. We’ve optimized a lot along the way so we can get more robust and higher-quality data.
How does CryoSat-2 measure sea ice depth and distinguish between first year and multi-year ice?
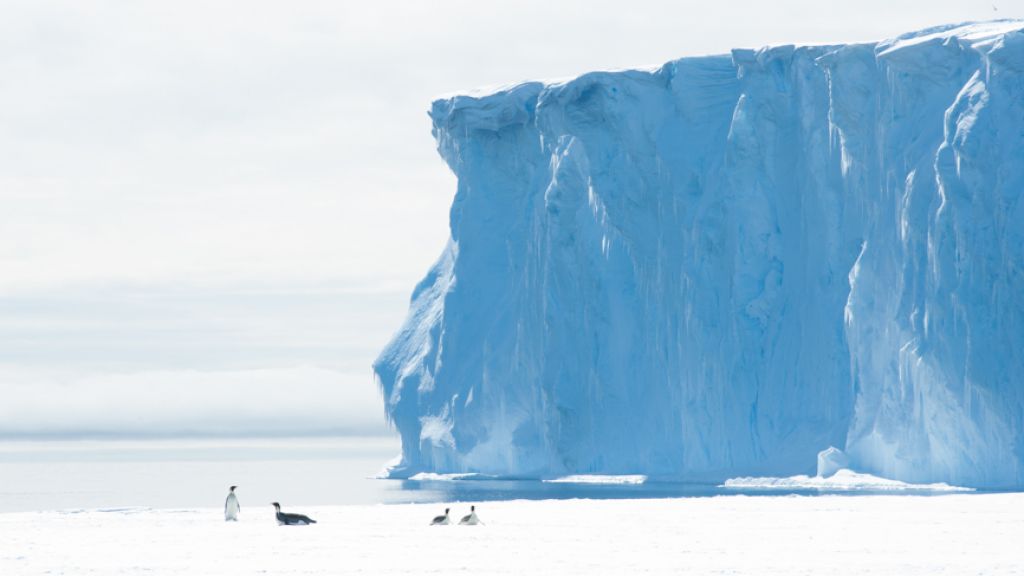
The main principle used when measuring sea ice thickness is to look at the freeboard (the part of sea ice that sticks up above the water). The freeboard of the sea ice is balanced by the draught of the sea ice (the ice below the water line). According to the laws of physics concerning buoyancy of the ice, if you can measure the freeboard of the sea ice accurately enough you can use the density relationship to determine the average thickness of the sea ice (the ice is sitting in the water in an isostatic relationship determined by the mean density of the ice).
In order to measure the height of the freeboard above the surface of the water, we look at the gaps in between the sea ice and measure the reference level of the sea surface. This way we can calculate the relative elevation of the surface of the sea ice floes above the mean sea level. Then, using a density relationship we can determine the mean sea ice thickness.
On average, this method is quite accurate. This is despite the fact that the ice varies in density, and external factors (such as the amount of snow on the surface of the sea ice, since snow is nearly transparent to the microwaves the satellite uses to take measurements) can introduce uncertainties in measurements of the freeboard. However we’re doing a very extensive job trying to understand the measurement error source caused by these factors, so that we’ll be confident in the data we deliver on thickness so we’ll be able to give users a solid margin of error linked to certain factors.
This is how the CryoSat mission differs from previous missions. We’re making a very serious effort to give validation of the measurements and allow measurements to be delivered with their uncertainty estimates. It’s very important for the user community to have every confidence in the data, which we plan to start delivering to the scientific community at large in the autumn.
What kind of ground truthing campaigns have you been running?
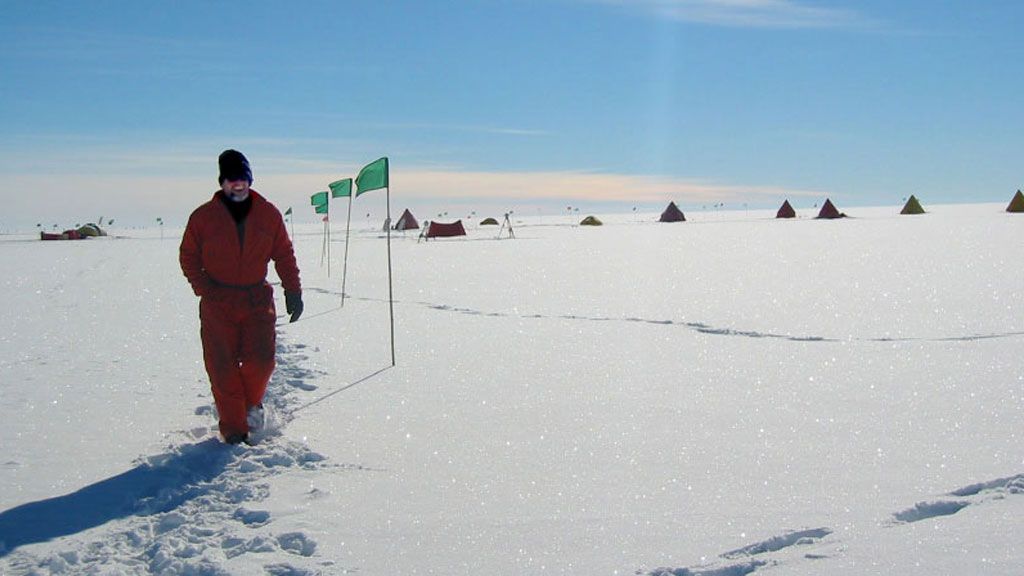
There have been a number of ground truthing campaigns (including the snow depth measurements Alain Hubert took during his 2007 Arctic Arc expedition). However the most important phase of the mission is now, when we can get information on the ground underneath the satellite as it's operating. This allows us to fine-tune the instrument and optimize the data processing to get the best quality data.
Now that the satellite’s been launched, we’ve begun to embark on a number of airborne activities. For example, we’ve had a collaboration with NASA. They took measurements using a laser altimeter from the DC-8 aircraft they’ve been using for their Ice Bridge project over the Arctic sea ice at the same time CryoSat-2 was passing overhead.
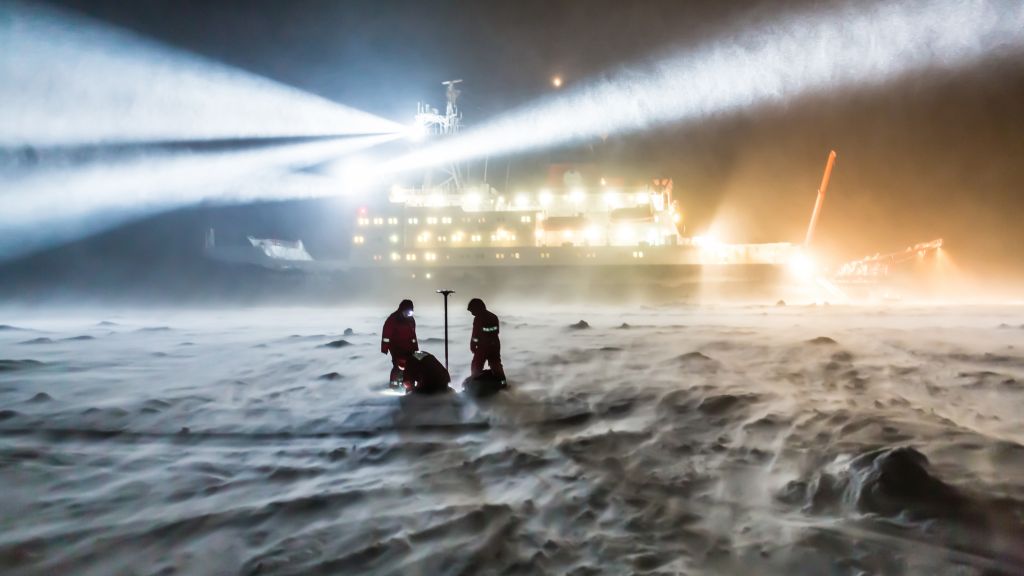
We’re now also embarking on a serious phase on instrument checks, which will help us deduce instrumental effects and to tune the instruments so we can get the best quality data before we distribute it to scientists. This spring, ESA organized some airborne campaigns in Greenland and on the Arctic sea ice. There, we’ve got people on the surface making in-situ measurements of the snow and ice on the surface together with a variety of sensors to measure snow depth and snow density, so we have independent measurements taken at the same time as the satellite flies over. This will give us statistics to validate the quality of the satellite data.
How long will these field measurements go on for?
The maximum snow accumulation on both the Greenland Ice Sheet and on the sea ice occurs before the spring melt begins, so typically we’ve done a few campaigns before the spring melt started. Then we’ll repeat similar campaigns after the summer melt is over in September and October when the surface has been transformed by melting. These two complimentary sets of activities and similar experiments in 2011 will give us access to information about any potential seasonal impact on the quality of the measurements, which in turn will give us the ability to validate the data under different seasonal conditions. And that’s they key thing.
Then we’ll turn our attention to the other end of the Earth when conditions and logistical means allow us to do experiments in Antarctica during the austral summer of 2010-2011.
So does this mean by next spring you’ll be able to give reliable data to the scientific community?
By July 2010 we hope to start distributing data to a limited number of scientists – with a caveat of course – before we open distribution to a much wider user community. The validation that would have to take place before mid-summer will probably give us enough confidence to allow our calibration and validation team to really get a solid understanding of the data and be able to recognize what kind of margin of error measurements can produce and why and correct for that.
We’re first going to start distributing data to a select team of external scientists who applied to be testers of the initial data products. They’ll provide us with feedback on the quality of the product, which will help us revise the processing of the products to try and get the highest possible quality data out to the broader user community.
What will happen when the commissioning comes to an end?
The mission objectives and climate-related aspects of the mission require that we need a robust time series of data so we can start looking at changes over time. I hope in a year’s time we can say that we have a robust instrument that’s delivering high-quality series of continuous measurements, and with that we can start to build up a month-to-month picture of how changes are taking place in both the sea ice thickness and the surface topography of the ice sheets and how its changing in response to ice dynamics, melting or snow accumulation. The nominal lifetime of the mission is three and a half years, but present indications based on onboard fuel resources are that we may be able to operate up to five years or more (if all the instruments continue to function successfully).
The satellite is on all the time in these different modes, and there’s a relatively stable pattern of when each of the instrument modes will be switched on. We’d like to have robust statistics for any given area of the world. This means that we’ll use the same mode of the three modes I mentioned earlier each time we visit an area, so our datasets are comparable with one another and they can be used to generate an accurate time series without any inconsistencies.
Will CryoSat-2 concentrate its observations on particular regions during certain times of the year?
That’s related to the in-situ experiments. We’re going to carry out validation experiments throughout the satellite’s lifetime focusing our resources on airborne activity and in-situ measurements. For this reason we have a number of key sites to monitor, such as a transect along the Greenland Ice Sheet. This is a key transect called the EGIG line. It allows us to take measurements along the satellite’s orbit and map from both the surface and the satellite at repeated intervals. Both ESA and NASA scientists are focusing a lot of their activities here. In this way we can build an economy of scale so that we can benefit from both the ESA and NASA efforts along this EGIG line in understanding not only the quality of the data but also the climate implications of the ice sheet change. We have similar sites on Devon Island in northern Canada, in Svalbard and in Antarctica.
Will there be coordination regarding other investigations besides just measuring sea and land ice thickness?
Absolutely. There will be a variety of in-situ measurements. Measuring precise elevation changes in the ice with GPS, measuring snow characteristics, using a neutron probe (a device typically used to measure the amount of water present in soil) to measure snow density with depth. And over sea ice there’s an innovative instrument called an electromagnetic probe, which uses magnetic induction to determine the thickness of the ice. We’ll use these methods to obtain an independent measurement to verify the CryoSat data.

Mark Drinkwater
Dr. Mark Drinkwater is the head of ESA’s Mission Science Division, which is responsible for ensuring the fitness of purpose of new ESA Earth Observation missions via its support of scientific and experimental campaign activities.